Every insurance team believes they are data-driven.
There are dashboards on screens, weekly performance reports, and KPIs discussed in almost every meeting. On paper, everything looks structured, measurable, and under control.
But there is a recurring problem in insurance analytics that rarely gets acknowledged:
The KPIs are accurate—but the interpretation of reality is not.
In other words, the system is measuring something real… but not necessarily something useful.
And over time, this gap becomes expensive.
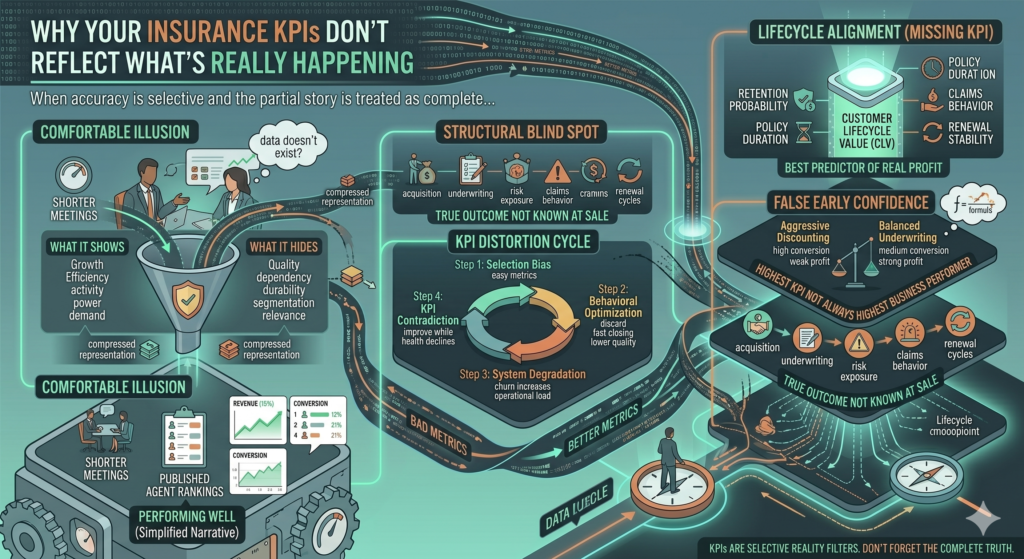
The comfortable illusion of “being data-driven”
Let’s start with a familiar situation.
A typical insurance agency meeting:
- Revenue is up 12% month-over-month
- Conversion rate improved from 18% to 21%
- Average deal size increased
- Agent productivity rankings are published
The conclusion is straightforward:
“We are performing well.”
But when someone quietly asks about retention, profitability per client, or cancellation patterns, the conversation becomes less confident.
Not because the data doesn’t exist—but because it is not part of the primary KPI narrative.
The core issue: KPIs are selective reality filters
A KPI is not reality.
It is a compressed representation of reality designed for decision-making.
And compression always removes something.
Let’s illustrate:
| KPI Type | What It Shows | What It Hides |
|---|---|---|
| Revenue growth | Business expansion | Customer quality |
| Conversion rate | Funnel efficiency | Discount dependency |
| New policies sold | Sales activity | Long-term durability |
| Average premium | Pricing power | Risk segmentation |
| Lead volume | Market demand | Lead relevance |
Each KPI tells a true story—but only a partial one.
The problem begins when organizations treat the partial story as complete.
A real insurance scenario: when KPIs contradict reality
Consider a company tracking three main KPIs:
- Monthly revenue
- Conversion rate
- Number of new policies
For three consecutive months, the numbers look strong:
| Month | Revenue | Conversion Rate | New Policies |
|---|---|---|---|
| 1 | €400K | 18% | 1,000 |
| 2 | €440K | 20% | 1,100 |
| 3 | €480K | 22% | 1,250 |
From a KPI perspective:
- everything is improving
- growth is accelerating
- performance is strong
But when we add delayed indicators:
| Hidden Metric | Month 1 | Month 2 | Month 3 |
|---|---|---|---|
| 60-day churn | 8% | 12% | 16% |
| Support cost per client | €14 | €18 | €24 |
| Renewal intent | 79% | 71% | 62% |
The contradiction becomes clear:
The system is growing in output, but degrading in quality.
Why insurance KPIs fail more often than other industries
Insurance is structurally different from transactional businesses.
A typical product lifecycle includes:
- acquisition
- underwriting
- risk exposure
- claims behavior
- renewal cycles
This means:
The true outcome of a sale is not known at the moment of sale.
Yet most KPIs are heavily weighted toward early-stage events.
This creates a structural blind spot.
The problem of “early success signals”
Insurance KPIs tend to overvalue early signals like:
- conversion rate
- sales velocity
- lead-to-policy ratio
These are useful—but incomplete.
They create what can be called:
False early confidence
Because early-stage performance often does not correlate with long-term profitability.
For example:
| Sales Strategy | Conversion Rate | 12-Month Retention | Net Profit |
|---|---|---|---|
| Aggressive discounting | High | Low | Weak |
| Balanced underwriting | Medium | High | Strong |
| Premium targeting | Low | Very High | Strong |
The highest KPI performer is not always the highest business performer.
The KPI distortion cycle
When KPIs are incomplete, they create a predictable cycle:
Step 1: KPI selection bias
Companies choose metrics that are:
- easy to measure
- easy to report
- easy to compare
Step 2: behavioral optimization
Teams adjust behavior to improve those KPIs:
- more discounting
- faster closing
- lower qualification standards
Step 3: system degradation
- customer quality decreases
- churn increases
- operational load increases
Step 4: KPI contradiction
- KPIs improve while business health declines
At this point, leadership often assumes:
- “We need more optimization”
when in reality: - “We need better metrics”
A closer look at conversion rate (the most misleading KPI)
Conversion rate is one of the most celebrated metrics in insurance.
But it has a hidden dependency:
Conversion rate increases when qualification standards decrease.
Let’s compare two scenarios:
| Scenario | Leads | Conversions | Conversion Rate | Customer Quality |
|---|---|---|---|---|
| A | 1,000 | 180 | 18% | High |
| B | 1,000 | 220 | 22% | Low |
Scenario B looks better in dashboards.
But leads to worse long-term outcomes:
- higher cancellations
- lower satisfaction
- weaker renewals
So the KPI improves while the business deteriorates.
The missing KPI: lifecycle alignment
One of the most important missing metrics in insurance is:
Customer Lifecycle Value (CLV) per acquisition source or agent
Unlike revenue or conversion rate, CLV includes:
- retention probability
- average policy duration
- claims behavior
- renewal stability
But it is often ignored because:
- it is harder to calculate
- it requires longer time horizons
- it is less intuitive in dashboards
Yet it is one of the strongest predictors of real profitability.
Why dashboards reinforce KPI blindness
Modern insurance dashboards are visually powerful.
They show:
- growth curves
- agent rankings
- funnel progression
- monthly comparisons
But they often lack:
- time-delay correlation analysis
- cohort-based retention views
- profitability normalization
- quality-weighted scoring
So users naturally focus on what is visible.
And ignore what is not.
The danger of single-layer KPIs
A single KPI system assumes:
One number can represent complex performance.
But insurance performance is multi-dimensional:
- acquisition efficiency
- customer quality
- retention behavior
- risk exposure
- operational cost
Reducing all of this into a few visible KPIs creates distortion.
Example: two agents, same KPIs, different reality
| Agent | Revenue | Conversion Rate | Retention | Profitability |
|---|---|---|---|---|
| A | €60K | 22% | 55% | Low |
| B | €58K | 18% | 82% | High |
Agent A looks better in most dashboards.
But Agent B is more valuable to the business.
This is the core KPI paradox in insurance:
The easiest metrics to improve are often the least aligned with long-term success.
The hidden cost of KPI misalignment
When KPIs fail to reflect reality, three costs emerge:
1. Strategic misdirection
Leadership invests in scaling the wrong behavior.
2. Operational inefficiency
Teams optimize for metrics instead of outcomes.
3. Financial leakage
Profitability declines despite “improving performance.”
What better KPI systems look like
High-performing insurance organizations usually redesign KPIs around:
1. Time-based metrics
- 6-month and 12-month retention
- cohort-based revenue stability
2. Quality-weighted metrics
- risk-adjusted revenue
- claim ratio per segment
3. Lifecycle metrics
- customer lifetime value
- renewal probability by acquisition source
4. Profit-based metrics
- net margin per policy
- cost per retained customer
The key mindset shift
Traditional KPI thinking:
“What can we measure monthly?”
Modern KPI thinking:
“What metrics best predict 12–24 month business health?”
This shift changes everything:
- what is tracked
- what is optimized
- what is rewarded
Final thought
Insurance KPIs are not usually wrong.
They are simply incomplete representations of a system that is more delayed, complex, and interdependent than the metrics suggest.
The danger is not that KPIs lie. The danger is that they only tell part of the truth—and teams forget that.
Real performance is not what looks good in a dashboard today.
It is what remains stable when the time delay between action and outcome finally reveals the full picture.