Most insurance agencies believe they are more in control than they actually are.
Not because they lack data, systems, or dashboards—but because they interpret visibility as control.
In reality, seeing more does not automatically mean understanding more.
And in insurance, that gap between visibility and control is where most operational problems quietly grow.
When everything feels under control
A modern insurance agency typically runs with:
- Real-time dashboards
- Sales performance tracking
- KPI-based bonuses
- CRM pipelines
- Weekly performance reviews
From the outside, this looks like a highly controlled system.
Leadership can answer questions like:
- How many policies were sold today
- Which agent is performing best
- What the conversion rate is this week
- How revenue compares month over month
Everything is measurable.
Everything is visible.
And that visibility creates a strong psychological effect:
“If we can see it, we can control it.”
But that assumption is where problems begin.
Visibility is not control
There is a fundamental difference between:
- Observing a system
- Controlling a system
Insurance dashboards are excellent at observation.
They show:
- outputs
- activity
- short-term performance
But control requires something deeper:
- understanding causality
- predicting delayed effects
- managing feedback loops
And most agencies don’t track those layers well.
The hidden complexity of insurance systems
Insurance is not a linear business.
It behaves more like a delayed feedback system:
- A sale happens today
- The customer experiences the service over time
- Claims may or may not occur months later
- Renewal decisions happen far in the future
So the real outcome of today’s decisions is not visible immediately.
This creates a structural illusion:
You think you are controlling performance today, but you are actually seeing the consequences of past decisions.
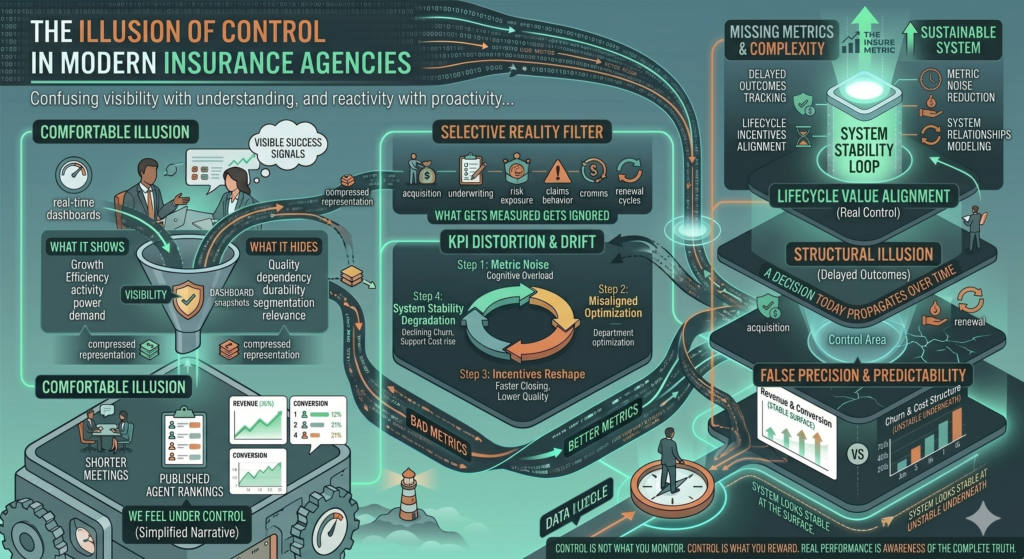
The dashboard effect: simplified reality
Let’s consider a typical dashboard:
| Metric | Value |
|---|---|
| New policies | 1,200 |
| Revenue | €450,000 |
| Conversion rate | 21% |
| Average deal size | €375 |
This suggests:
- growth
- efficiency
- stability
But it hides variables like:
- customer quality
- retention probability
- long-term profitability
- risk exposure
So what looks like control is actually just a partial snapshot.
The illusion of predictability
When metrics improve consistently, leadership often assumes predictability is increasing.
For example:
| Month | Revenue | Conversion Rate |
|---|---|---|
| 1 | €400K | 18% |
| 2 | €430K | 19% |
| 3 | €460K | 21% |
The trend is positive and stable.
But underneath, another pattern might exist:
| Month | 90-day churn | Support cost |
|---|---|---|
| 1 | 8% | €12/client |
| 2 | 12% | €16/client |
| 3 | 17% | €21/client |
So while revenue appears predictable:
- underlying cost structure is deteriorating
- customer stability is declining
This is the core issue:
The system looks stable at the surface while becoming unstable underneath.
Why control breaks in insurance agencies
Control breaks down in insurance for three main reasons:
1. Delayed feedback loops
Actions today only show results months later.
2. Multi-variable outcomes
A single sale impacts:
- revenue
- retention
- claims exposure
- customer satisfaction
3. Misaligned optimization
Teams optimize for visible KPIs, not system health.
The “local optimization” problem
One of the biggest illusions of control comes from optimizing parts of the system independently.
For example:
- Sales team optimizes conversion rate
- Marketing optimizes lead volume
- Operations optimizes processing speed
Individually, each improvement looks positive.
But collectively, the system may degrade.
Let’s illustrate:
| Department | KPI Optimized | Unintended Effect |
|---|---|---|
| Sales | Conversion rate | Lower customer quality |
| Marketing | Lead volume | Lower lead relevance |
| Operations | Speed | Reduced verification depth |
Each team improves their “control area.”
But no one controls the system as a whole.
Why more data can reduce control
Counterintuitively, adding more dashboards often reduces real control.
This happens because:
1. Cognitive overload
Too many metrics dilute focus.
2. False precision
Teams assume high data volume = high accuracy.
3. Fragmented decision-making
Each KPI becomes its own “truth.”
Instead of one coherent system view, you get multiple competing interpretations.
The incentive problem hidden inside control systems
Control is heavily influenced by incentives.
If agents are rewarded for:
- number of policies sold
- monthly revenue
- short-term conversion
Then the system will naturally drift toward:
- faster closing
- lower qualification
- higher churn later
Even if leadership believes they are in control, incentives quietly reshape behavior.
Control is not what you monitor. Control is what you reward.
A simple example of perceived control vs real control
Consider two agencies:
Agency A (high perceived control)
- 20 KPIs tracked daily
- detailed dashboards
- strict reporting structure
- aggressive targets
Agency B (low perceived control)
- fewer KPIs
- slower reporting cycles
- focus on 3 core metrics
Now compare outcomes:
| Factor | Agency A | Agency B |
|---|---|---|
| Sales growth | High | Moderate |
| Retention | Declining | Stable |
| Profitability | Volatile | Predictable |
| Operational stress | High | Low |
Agency A feels more controlled.
But Agency B is actually more stable.
The hidden feedback loop problem
Insurance systems contain multiple feedback loops:
- pricing affects customer quality
- customer quality affects retention
- retention affects acquisition pressure
- acquisition pressure affects pricing
When these loops are not explicitly modeled, control becomes reactive instead of proactive.
Teams respond to symptoms instead of causes.
Why leadership feels “busy but not in control”
A common pattern in insurance agencies:
- constant meetings
- constant reporting
- constant adjustments
Yet long-term outcomes remain unstable.
This creates a paradox:
The system feels more managed, but less controlled.
Because activity increases without system understanding improving.
What real control actually looks like
Real control in insurance does not mean more dashboards.
It means:
1. Understanding delayed outcomes
Tracking how today’s actions affect future retention and profitability.
2. Aligning incentives with lifecycle value
Rewarding long-term customer quality, not just acquisition.
3. Reducing metric noise
Focusing on fewer but more meaningful indicators.
4. Modeling system relationships
Understanding how sales, retention, pricing, and risk interact.
A shift in thinking: from control to stability
Instead of asking:
“How do we control performance?”
Better organizations ask:
“How do we make the system stable under different conditions?”
This shift is critical.
Because insurance is not a static system—it is a dynamic one.
Final thought
The illusion of control in insurance agencies comes from confusing visibility with understanding.
Dashboards make systems feel manageable.
But real control requires something deeper than observation—it requires awareness of how decisions propagate over time.
You don’t control an insurance business by seeing more. You control it by understanding what your metrics are not showing you.
And in most cases, the real risk is not lack of data.
It is overconfidence in the data you already have.