Most insurance problems don’t start with a crisis.
They start with a metric.
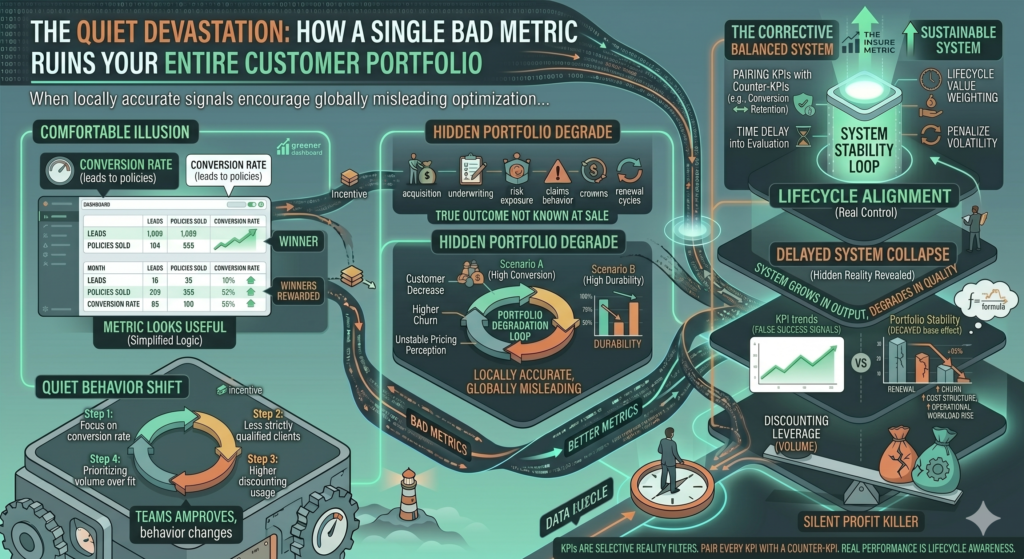
Not a dramatic failure, not a system outage, not a market shock—just one number that looks useful, gets added to a dashboard, and slowly becomes the thing everyone tries to optimize.
At first, it improves performance.
Then it reshapes behavior.
And eventually, it distorts the entire customer portfolio.
By the time the consequences are visible, the metric has already done its job—just not the job anyone intended.
The quiet power of a single KPI
In insurance agencies, decision-making is often centralized around a small set of KPIs:
- conversion rate
- policies sold
- monthly revenue
- average premium
- acquisition cost
Each one feels harmless in isolation.
But the system reality is different:
Every KPI becomes an instruction once it is tied to evaluation or incentives.
And that is where the problem begins.
A real-world pattern: the “conversion rate trap”
Let’s take a common example.
A company decides to improve one metric:
Increase conversion rate from leads to policies.
At first, nothing unusual happens. Teams review scripts, improve follow-ups, refine targeting.
Then performance starts improving:
| Month | Leads | Policies Sold | Conversion Rate |
|---|---|---|---|
| 1 | 1,000 | 180 | 18% |
| 2 | 1,000 | 200 | 20% |
| 3 | 1,000 | 230 | 23% |
Leadership is satisfied.
The metric is improving.
Bonuses increase.
Dashboards turn greener.
But something else is changing underneath.
The invisible trade-off: quality leakage
To improve conversion rate, agents naturally begin to adjust behavior:
- less strict qualification
- faster acceptance of borderline clients
- reduced objection handling depth
- more discount usage
- prioritizing easy decisions over optimal ones
This does not appear in the conversion metric.
But it appears later in the system.
| Hidden Outcome | Month 1 | Month 3 | Month 6 |
|---|---|---|---|
| 60-day cancellations | 8% | 13% | 19% |
| Claims frequency | Normal | Slight increase | High |
| Support cost | €10/client | €14/client | €21/client |
The metric improved.
But the portfolio quality degraded.
Why bad metrics are so dangerous
A bad metric is not one that is incorrect.
It is one that is:
locally accurate but globally misleading
It reflects a real behavior—but encourages the wrong optimization.
In insurance, this is especially dangerous because:
- outcomes are delayed
- feedback loops are long
- risk exposure is nonlinear
- customer value accumulates over time
So distortion doesn’t show immediately.
It compounds.
The portfolio effect nobody tracks
Insurance is not a collection of individual sales.
It is a portfolio of risk profiles.
Each customer contributes:
- revenue
- claims risk
- retention probability
- operational cost
A single metric like “conversion rate” ignores all of this.
Let’s compare two portfolios:
| Portfolio A | Portfolio B |
|---|---|
| 23% conversion rate | 18% conversion rate |
| High discount usage | Low discount usage |
| Low qualification threshold | High qualification threshold |
| High churn | Low churn |
| Unstable profit | Stable profit |
Portfolio A looks better in dashboards.
Portfolio B performs better in reality.
The reinforcement loop that makes it worse
Once a metric is introduced, it creates a feedback loop:
Step 1: Metric is introduced
“Improve conversion rate.”
Step 2: Behavior adapts
Agents optimize for easier conversions.
Step 3: Metric improves
Conversion rate increases.
Step 4: Incentives reinforce behavior
Bonuses, recognition, rankings improve.
Step 5: Portfolio quality declines (delayed)
Higher churn, lower lifetime value.
Step 6: Organization responds by doubling down
“Let’s push conversion even higher.”
This is the critical failure point:
The system interprets symptoms as success signals.
A subtle example: average premium per policy
Another commonly used metric is average premium.
At first glance, it seems reliable:
- higher premium = better customers
- lower premium = weaker revenue
But it can be distorted easily.
| Strategy | Average Premium | Outcome |
|---|---|---|
| Premium targeting | High | Lower volume, high stability |
| Discount expansion | Medium | High volume, low stability |
| Aggressive bundling | Artificially high | High churn risk |
If agents are incentivized incorrectly, they can increase average premium while:
- increasing risk exposure
- reducing retention
- misclassifying customers
Again:
The metric improves while the system weakens.
Why organizations fall in love with bad metrics
Bad metrics persist for three reasons:
1. They are easy to measure
No delay, no complexity, no modeling needed.
2. They feel intuitive
More conversions, more revenue—simple logic.
3. They create fast feedback
Teams see immediate improvement.
But insurance is a delayed system.
So fast feedback is often misleading feedback.
The hidden cost: portfolio imbalance
Over time, a single bad metric can reshape the entire customer base.
For example:
| Year | Customer Type | Risk Level | Retention |
|---|---|---|---|
| 1 | Balanced mix | Medium | Stable |
| 2 | Discount-heavy acquisitions | High | Declining |
| 3 | Low-quality expansion | Very High | Weak |
| 4 | Portfolio instability | Uncontrolled | Volatile |
What started as a KPI optimization problem becomes a structural business problem.
Why you don’t notice until it’s too late
There is a delay mechanism in insurance systems:
- acquisition effects are immediate
- retention effects are delayed
- risk effects are long-term
- financial effects lag behind behavior
So leadership sees:
- improving KPIs
- growing revenue
- strong acquisition
While the system is actually:
- accumulating risk
- degrading quality
- weakening retention
This creates what can be called:
delayed system collapse under perceived success
The discounting example: how one metric reshapes everything
Let’s assume a company introduces one KPI:
“Increase discount-adjusted conversion rate.”
Immediately, behavior shifts:
| Behavior | Short-Term Effect | Long-Term Effect |
|---|---|---|
| More discounting | Higher conversion | Lower profitability |
| Faster closing | Higher sales volume | Lower customer fit |
| Reduced friction | Better KPI performance | Higher churn |
Within months:
- conversion improves
- revenue increases
- leadership is satisfied
Within a year:
- churn rises
- margins compress
- acquisition dependency increases
The metric did exactly what it was designed to do.
The problem is what it did not measure.
The deeper issue: missing counter-metrics
A single metric becomes dangerous when there is no counterbalance.
For example:
| Primary Metric | Missing Counter-Metric |
|---|---|
| Conversion rate | Retention rate |
| Revenue growth | Net retained revenue |
| Average premium | Risk-adjusted premium |
| Policies sold | Lifetime value per policy |
Without counter-metrics, systems optimize blindly.
A better way to think about metrics
Instead of asking:
“Is this KPI improving?”
You should ask:
“What behavior does this KPI reward, and what behavior does it ignore?”
Because every metric has two outputs:
- what it measures
- what it incentivizes
The second one is often more important.
What strong insurance organizations do differently
High-performing agencies tend to:
1. Pair every KPI with a counter-KPI
- conversion rate ↔ retention rate
- revenue ↔ margin stability
- acquisition ↔ churn
2. Introduce time delay into evaluation
- 3-month, 6-month, 12-month performance tracking
3. Weight metrics by lifecycle value
- not just acquisition volume
4. Penalize volatility, not just underperformance
- unstable portfolios are treated as risk signals
The mindset shift that prevents portfolio damage
Weak systems ask:
“How do we improve this number?”
Strong systems ask:
“What happens to the portfolio if this number improves for the wrong reasons?”
That distinction changes everything.
Because it shifts focus from:
- metric optimization
to:
- system health
Final thought
A single bad metric does not destroy an insurance portfolio overnight.
It does something more subtle—and more dangerous.
It slowly trains the system to optimize the wrong version of success.
And by the time the damage is visible in financial results, the behavior that caused it has already become standard practice.
In insurance, the real risk is not missing data.
It is trusting the wrong signals for too long.