Implementing analytics in an insurance company sounds like a clear upgrade.
Better data, better decisions, better performance.
That’s the expectation.
The reality is more complicated.
Because once analytics enters an insurance organization, it doesn’t just “measure” the business—it starts reshaping how the business behaves.
And that behavioral shift is where most companies underestimate the cost.
The moment analytics becomes operational reality
In most insurance agencies, the implementation follows a familiar pattern:
- A dashboard is introduced
- KPIs are defined
- Teams are trained
- Performance tracking begins
- Leadership gains visibility
At first, everything improves:
- faster reporting
- clearer performance comparison
- more structured decision-making
- reduced reliance on intuition
It feels like control has increased.
But something else is happening in parallel.
The first hidden shift: behavior starts aligning with metrics
Once analytics becomes visible, it becomes influential.
Not because people are told to optimize for it explicitly—but because:
What is measured becomes what is noticed.
And what is noticed becomes what is rewarded.
So naturally, teams begin to adapt.
Sales teams:
- prioritize measurable conversions
- focus on faster closes
- reduce “unproductive” leads
- optimize for KPI performance
Marketing teams:
- push for higher lead volume
- prioritize easy-to-track channels
- favor short-term campaign results
Operations teams:
- optimize speed and throughput
- reduce process friction
- simplify cases for efficiency
Individually, these changes look positive.
But system-wide, they begin to shift the structure of the portfolio.
The hidden side effect: optimization replaces understanding
Before analytics:
- decisions were slower
- but context was richer
After analytics:
- decisions are faster
- but context is reduced
This creates a subtle transformation:
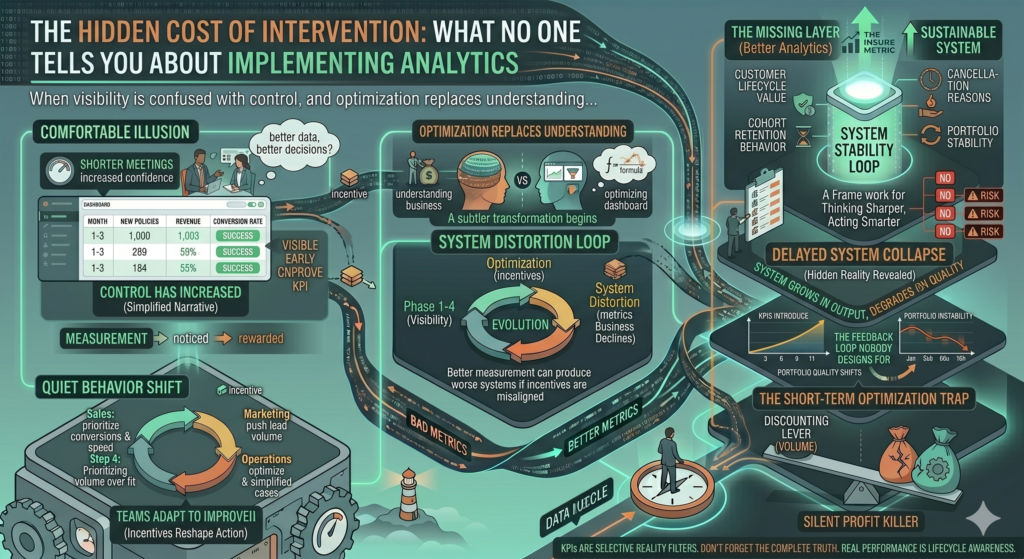
The organization shifts from understanding the business to optimizing the dashboard.
And those are not the same thing.
A typical insurance dashboard evolution
Let’s look at how analytics systems evolve over time.
Phase 1: Visibility phase
- basic KPIs introduced
- focus on reporting accuracy
- leadership gains transparency
Phase 2: Optimization phase
- KPIs tied to incentives
- performance comparisons introduced
- competition between agents increases
Phase 3: Behavioral adaptation phase
- teams learn how to “win the dashboard”
- shortcuts emerge
- quality trade-offs begin
Phase 4: System distortion phase
- metrics improve
- business quality declines
- retention weakens
- profitability becomes unstable
This progression is extremely common.
And often invisible until Phase 4.
The illusion of precision
One of the strongest psychological effects of analytics is precision.
When numbers are available, they feel definitive.
For example:
| Metric | Value |
|---|---|
| Conversion rate | 21.3% |
| Average premium | €412 |
| Monthly revenue | €480,000 |
| Lead response time | 6.4 minutes |
These numbers create confidence.
But precision does not equal correctness.
It only means:
The system is measuring something consistently—not necessarily something meaningful.
When analytics changes what “good performance” means
Before analytics:
- good performance = experienced judgment + customer outcomes
After analytics:
- good performance = KPI improvement
This shift seems subtle.
But it has deep consequences.
Because now:
- agents optimize for numbers
- managers evaluate based on dashboards
- leadership makes decisions based on aggregates
And the actual customer experience becomes secondary.
The most dangerous outcome: metric gaming
Once analytics is tied to performance evaluation, a predictable behavior emerges:
People learn how to improve metrics without improving reality.
Examples in insurance:
Conversion rate gaming
- accepting easier clients
- reducing qualification standards
Revenue gaming
- pushing short-term premium increases
- discount manipulation to close faster
Activity gaming
- increasing calls without improving outcomes
- optimizing volume over quality
None of this is malicious.
It is simply rational behavior inside a measured system.
A real example: analytics improves performance… until it doesn’t
Consider an insurance agency before and after analytics implementation:
Before analytics:
| Metric | Value |
|---|---|
| Conversion rate | 17% |
| Retention rate | 78% |
| Net profit margin | Stable |
After analytics (6 months later):
| Metric | Value |
|---|---|
| Conversion rate | 23% |
| Retention rate | 62% |
| Net profit margin | Declining |
On paper:
- everything improved
In reality:
- portfolio quality deteriorated
This is the core paradox of analytics:
Better measurement can produce worse systems if incentives are misaligned.
Why insurance is especially vulnerable
Insurance amplifies this effect because of its structure:
1. Delayed outcomes
A sale today may not show its true quality for months.
2. Multi-factor value
Each customer contributes:
- revenue
- risk exposure
- retention behavior
- claims behavior
3. Long feedback loops
The system reacts slowly, making early distortions invisible.
So by the time analytics reveals an issue:
- the behavior causing it is already entrenched
The “short-term optimization trap”
Once analytics is introduced, teams tend to optimize for what is immediately visible.
For example:
| Metric | Optimized Behavior | Hidden Cost |
|---|---|---|
| Conversion rate | Faster closing | Lower customer quality |
| Response time | Faster replies | Less qualification depth |
| Lead volume | More campaigns | Lower lead relevance |
This creates a pattern:
Immediate gains, delayed losses.
The missing layer in most analytics systems
Most insurance analytics systems track:
- acquisition
- conversion
- revenue
- activity
But they often miss:
- customer lifetime value
- cohort retention behavior
- cancellation reasons
- risk-adjusted profitability
- portfolio stability
Without these, the system becomes one-dimensional.
Why dashboards accelerate distortion
Dashboards amplify analytics effects in three ways:
1. Visibility bias
What is displayed becomes what matters.
2. Ranking pressure
Agents compete on visible KPIs.
3. Simplification pressure
Complex outcomes get reduced into single numbers.
Over time, dashboards stop being neutral tools.
They become behavioral engines.
The feedback loop nobody designs for
Once analytics is active:
- KPI is introduced
- Behavior adapts
- KPI improves
- Incentives reinforce behavior
- Portfolio quality shifts
- KPI no longer reflects reality
- System introduces more KPIs
This creates an expanding loop of measurement without correction.
The hidden cost: loss of signal quality
As more metrics are introduced, signal quality often decreases.
Because:
- important signals get diluted
- noise increases
- focus shifts across too many indicators
Eventually:
The system has more data but less clarity.
A better way to implement analytics
High-performing insurance organizations typically avoid these issues by:
1. Defining counter-metrics
Every KPI has an opposing indicator:
- conversion ↔ retention
- revenue ↔ margin stability
2. Introducing time-delay validation
- 3-month, 6-month, 12-month outcome tracking
3. Measuring portfolio health, not just activity
- risk-adjusted revenue
- cohort-based profitability
4. Limiting KPI exposure
- fewer but more meaningful metrics
The mindset shift that changes everything
Weak analytics thinking:
“What can we measure better?”
Strong analytics thinking:
“What behavior will this measurement create over time?”
Because analytics does not just describe a system.
It reshapes it.
Final thought
Analytics in insurance is not a neutral upgrade.
It is an intervention in how the entire system behaves.
And like any intervention, it has side effects.
The goal is not to measure everything possible—but to measure what keeps the system truthful over time.
Because in insurance, the biggest risk is not lack of data.
It is believing that data automatically equals understanding.